Boost profit by at least 100%
The average profit margin in cafes, restaurants & takeaways is <6%. Our customers make 12% - 25% profit.
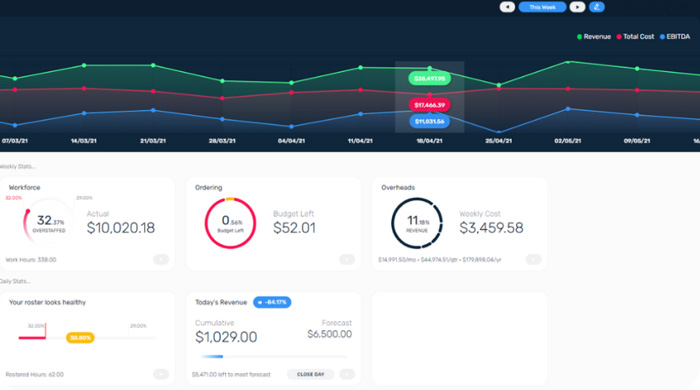
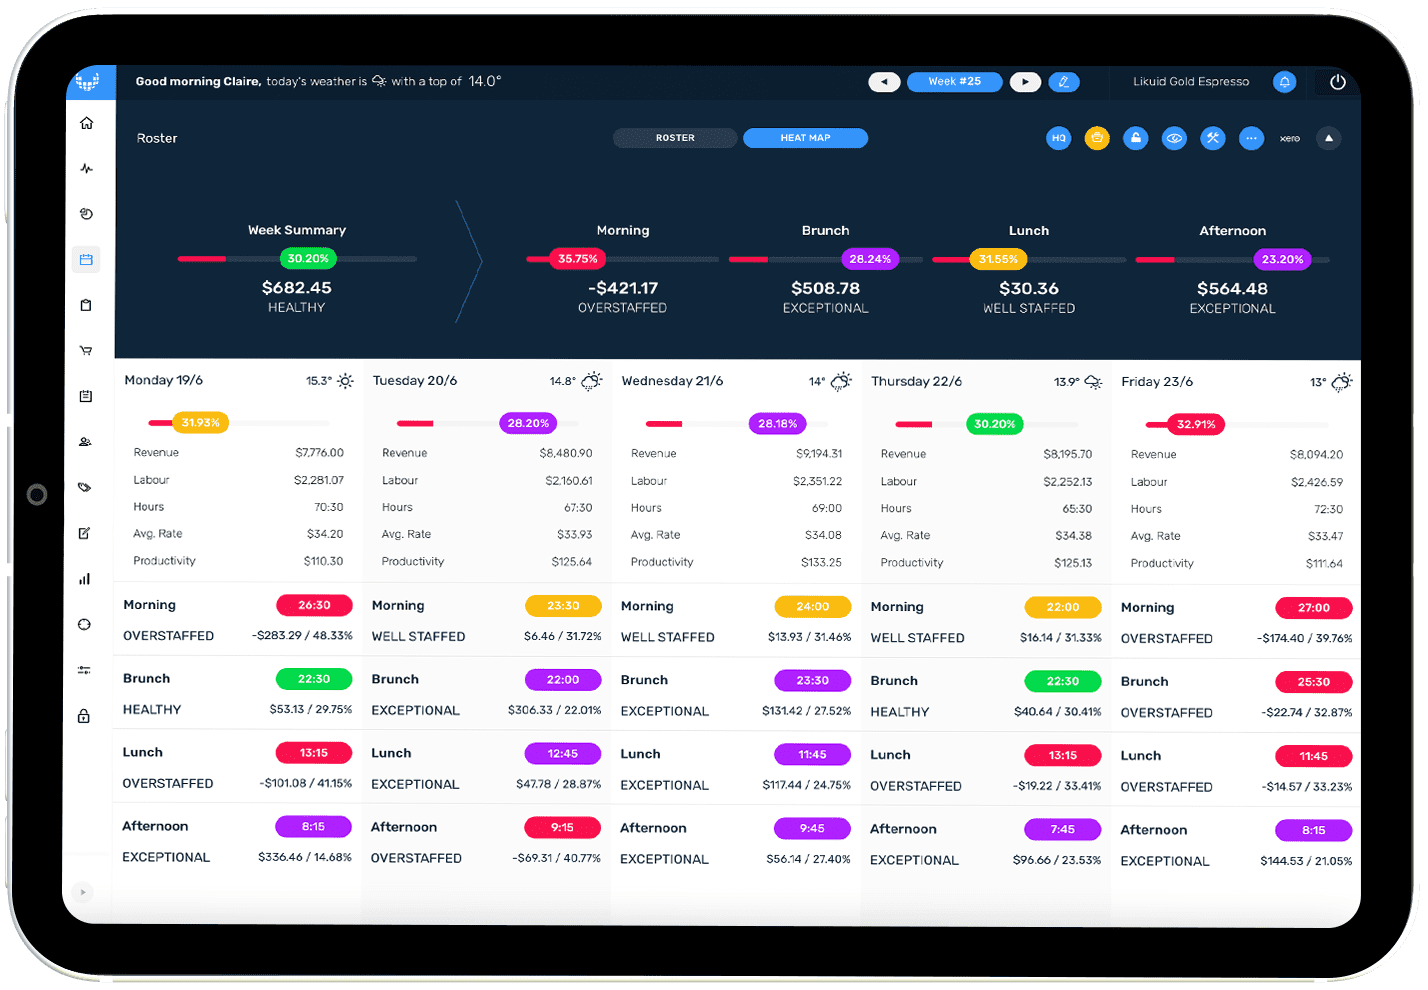
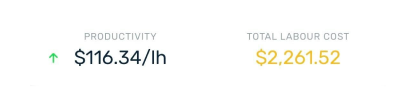
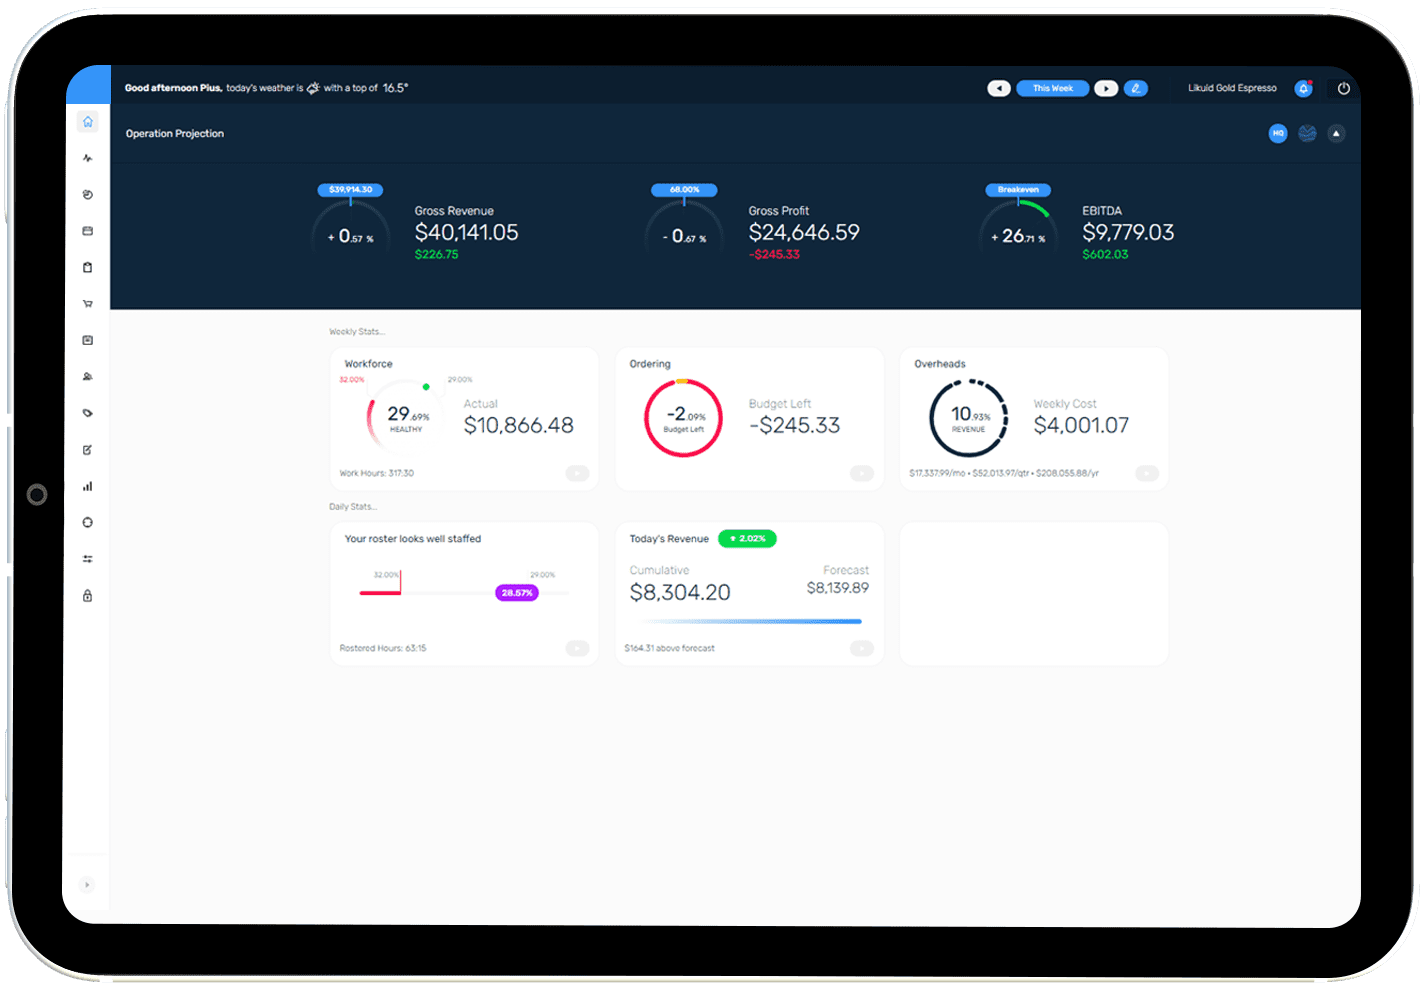
Streamline with real-time data capture
Understand your financial position, anticipate costs, and improve team productivity and profit without the need for manual data entry.
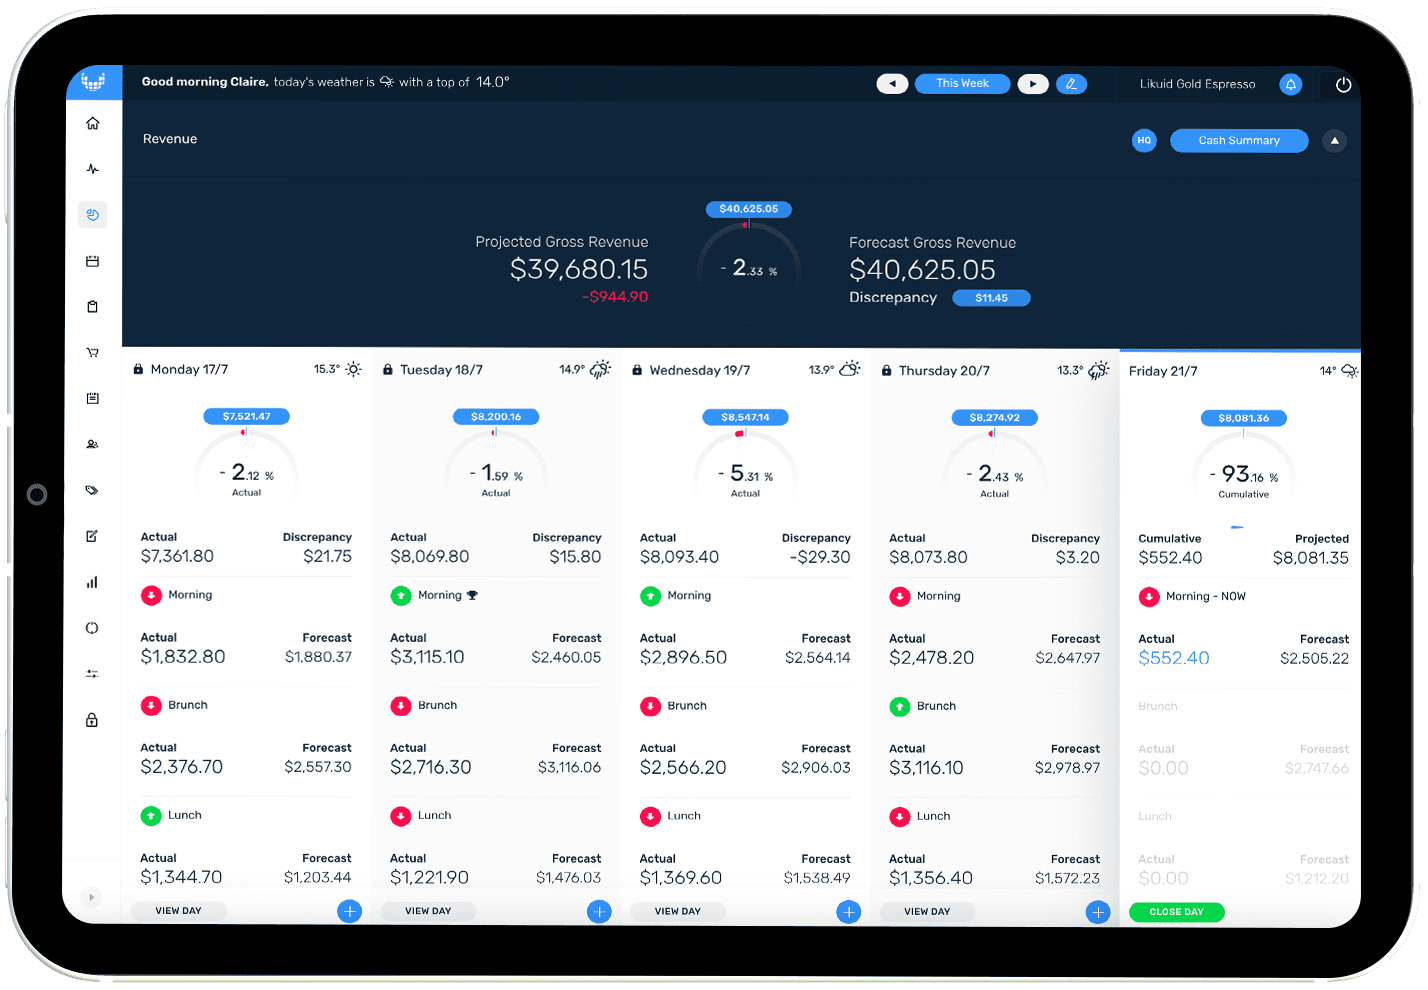
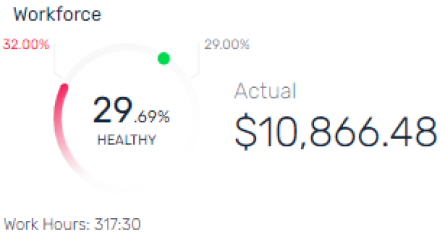
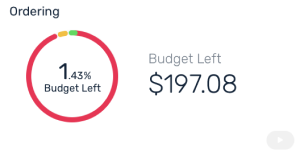
Keep your team connected
Empower your team with minute-to-minute, remote control over staffing, purchasing, and overheads operations.
Get hands-on help with robust training
Onboarding is easy with assistance tailored to your operations. Experience service a notch above the rest.
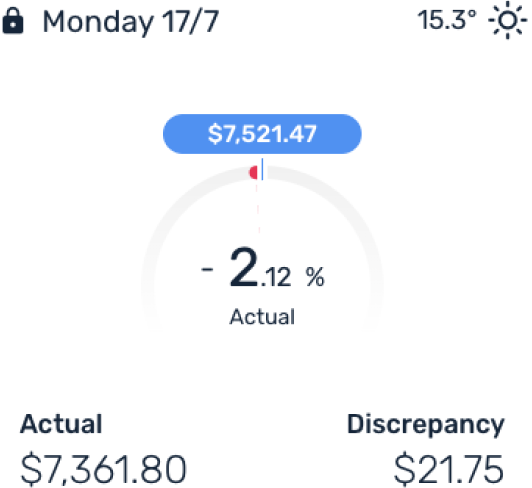
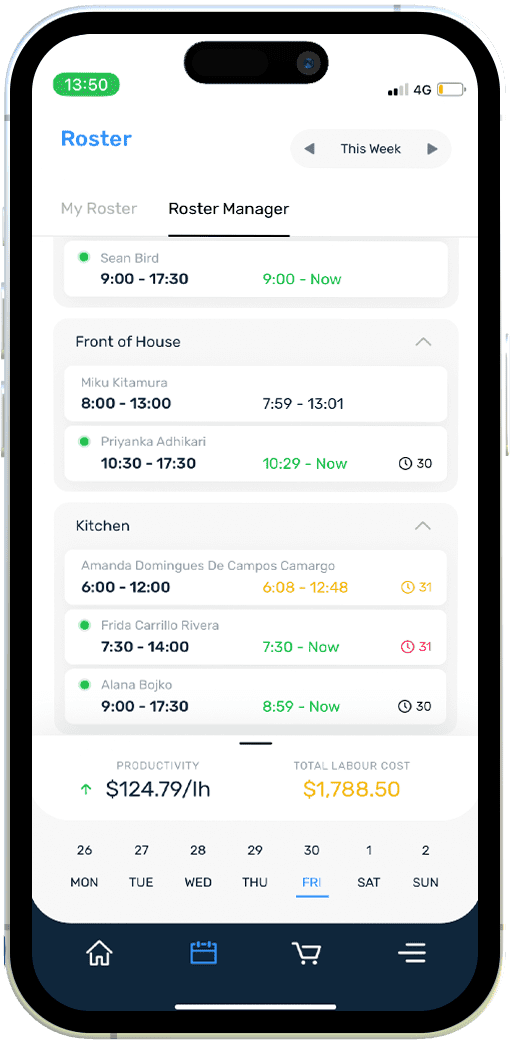
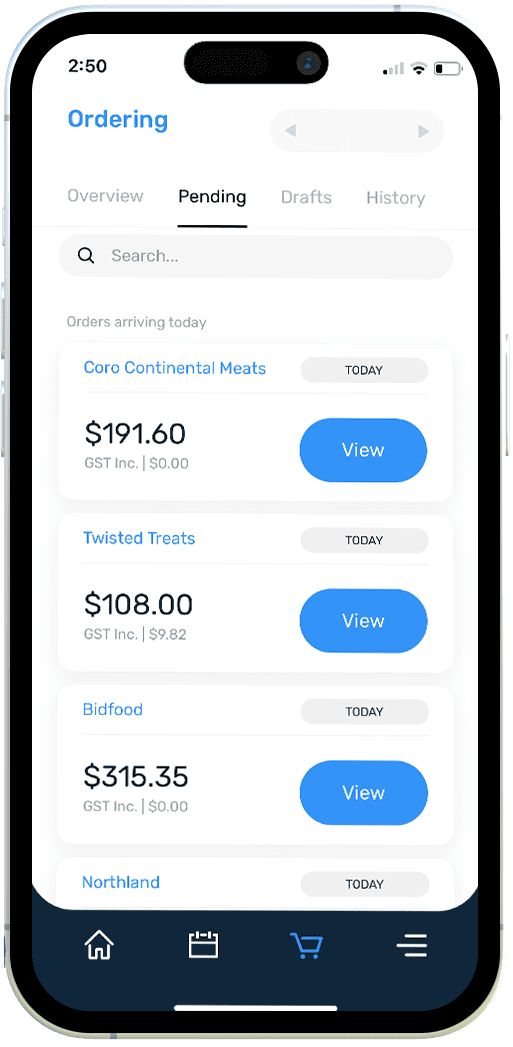
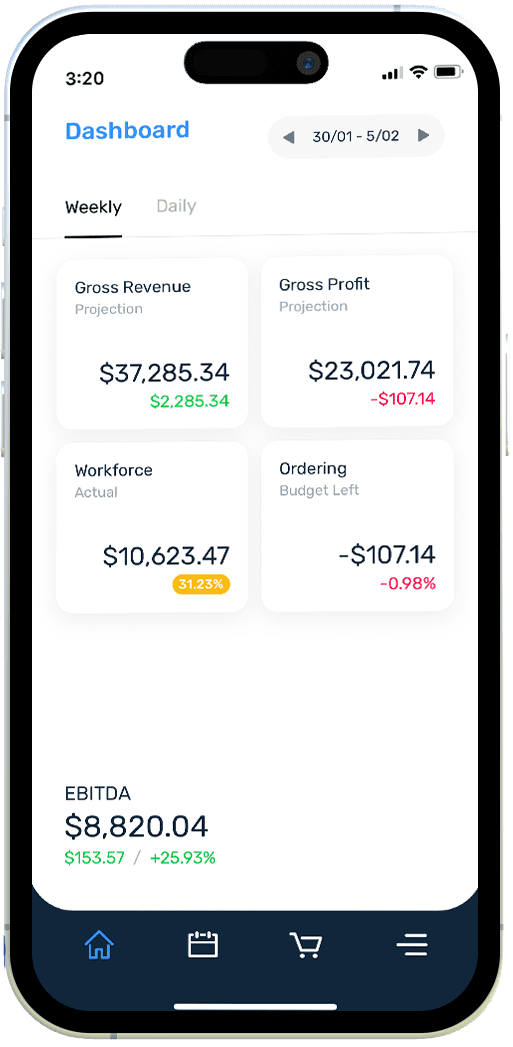
Manage your business from the palm of your hand
Have the numbers you need in the palm of your hand with our iOS and Android apps.
Have the peace-of-mind that your data is secure
Rest assured that your data is protected with robust security measures.